Over the years, I’ve done my share of troubleshooting. Sometimes it’s quick, sometimes…not. Along the way, I’ve learned to never underestimate my ability to assume something or overlook a fact and go down the wrong path. That’s lesson No.1: A little humility goes a long way.
What really helps me is to list hypotheses (i.e. possible causes), assign them priorities, and just jot down a note when I think I’ve eliminated a possible cause, indicating WHY that cause was eliminated. The priority indication helps me slow down a bit, step back, and make sure we try the most likely things first. This “methodology” dates back to the 90s and the Cisco Troubleshooting class (CIT) we used to teach. It works!
I also have learned that conducting a “post mortem” or “lessons learned” helps improve any process. So every time I troubleshoot a problem, I think about what I or others could have done to speed up problem resolution.
Here are two issues I encountered recently and what I learned from observing the troubleshooting process for each. We’ll continue with a related point, which is setting proper expectations with users, especially CEOs. And we’ll wrap up with a discussion of scoping, i.e. gathering the information needed for you or me to efficiently tackle a problem.
CEO wireless No. 1
I don’t know what it is about CEOs and wireless. I do know that when they aren’t happy, that generally leads to lots of other people being unhappy. The problem was, the CEO had far better Ookla speed test results on his non-corporate iPad at home than in his high-rise office on corporate WiFi.
In case No. 1, a bunch of people were trying to troubleshoot the problem. It turned out there were some speedbumps in the path the wireless had to take doing CAPWAP back to the WLC controller, and from there to the internet. There were three lessons learned (from my perspective anyway):
- If it’s a priority and you have the people to do this, don’t serialize — i.e., don’t focus on one thing at a time. Find ways for different people to investigate different parts of the problem. Do communicate, and coordinate making changes or anything that might affect the others’ troubleshooting. Make only one change at a time, and if that doesn’t solve the problem, put things back the way they were, unless the change was a good idea anyway.
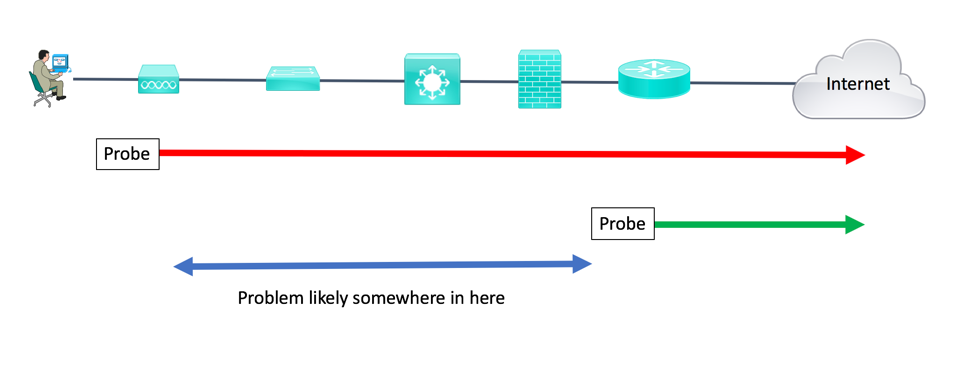
- Differential comparison. One of the problems was found when the team failed the Wireless Controller (WLC) over to the other in the active/passive pair. The second one worked much better. It turned out the 6500 switch the primary WLC was attached to had a performance problem relating to QoS and not doing fully distributed CEF due to lack of a DFC daughtercard. The other switch didn’t have that problem.
- Automate measurements. We installed a NetBeez It can do periodic Ookla speedtests, or iperf throughput tests. Ookla is handy because that’s what users tend to base complaints on. Having a human taking periodic measurements several times a day and entering them into Excel is (a) less accurate, (b) only useful if you really don’t like that person. (Only half joking here.)
Differential comparison
CEO wireless No. 2
In CEO case No. 2, same symptom: Ookla much slower than expected. “We’re paying for 100 Mbps of Internet, so why is my throughput 5 to 10 Mbps?”
In that particular case, we used a wireless NetBeez. They report lots of interesting WLAN info from the client perspective. Paying attention to detail, our troubleshooter found that the AP nearest the CEO was not allowing association on the 5 GHz band. So the CEO was associating with a further-away AP, hence getting poor throughput. Swapping APs fixed things; in fact, rebooting the problem AP cleared up the problem when it was tested elsewhere.
Using multiple NetBeez (“differential testing”), we established that from the CEO (well, nearby), throughput was not significantly worse than from the edge router. After some minor configuration changes, we discovered that the performance greatly picked up when we did not use the zScaler tunnel at the site. A change in how the site used zScaler then improved throughput for all.
Setting expectations
There’s another aspect to both the above stories. When you have 100 Mbps internet link, can you expect Ookla or other tests to actually show you 100 Mbps of throughput?
I finally came up with the following analogy:
It’s like having a four-lane on-ramp to the highway. If the main highway (the internet for our purposes) has a traffic jam, then that four-lane on-ramp doesn’t do you much good.
We also got into WLAN performance (there was lots of RF interference: high-rise office building, neighboring WLAN), plus the impact of latency on TCP throughput. Differential measurements from my home network (Ookla measurements direct from cable modem wired port versus behind my internal firewall/router/AP with extra four msec latency) sealed the deal, in not very technical terms. To wit, if you add network devices and latency, throughput goes down.
Ookla vs. iperf
Ookla is clever about trying to not load the link up. It uses algorithms to account for TCP slow start and try to estimate the proper throughput. In general, it seems to behave pretty well.
Using iperf stresses the network more, but I prefer it for baselining network performance. There’s no theory or algorithms that might produce artifacts. Although real network traffic … let’s not go there.
NetBeez compares the two tools here. There are internet-based iperf servers, or if you’re measuring between two sites you control, you can set up one end as a server and the other end as a client. That’s the biggest difference: speedtest uses internet-based servers, iperf requires you supply both endpoints.
Scoping
Another very important aspect of troubleshooting is scoping. I bring this up because it can be incredibly useful, but often gets overlooked. Scoping can really help your MTTR (Mean Time To Repair). This is a lesson learned from expending time at sites that didn’t do scoping well.
Scoping depends on good data about problems. A little bit of process, a ticketing tool, and staff training can help. What’s key is to get data such as the following:
- Who: Who is impacted? Everyone, just the third floor, etc.
- What: Good description of the problem — i.e., not just “broken,” but detail about the symptoms
- When: When did it happen? (9:17 a.m. is better than “it was flaky in the morning.”) How long did it last?
- Where: If the internet was slow, was response from internal servers slow? Were all apps slow, or just some? If some, which ones?
- Was there anything else going on at the time (weather, March madness, etc.)
Having comprehensive network, server, and SAN management data is the flip side of that. If you know that the event started at 9:17 a.m., you can look for interfaces with traffic surges, CPU spikes, etc. at/around 9:17 a.m. Better yet, if you have threshold alerts in a good logging tool (Splunk!), then check what was complaining around 9:17 a.m. in the logging tool. Even if you don’t have Splunk, if you just log all syslog and SNMP or other alerts to a single text file with good timestamps, that’ll let you quickly check out what was happening around 9:17 a.m., say +/- a minute or three.
Other tools
We like AppNeta for general observations, especially consistent data about remote-to-main site connectivity. Some of AppNeta’s recent announcements are interesting for greater application-centric awareness.
Regarding NetBeez and AppNeta: Virtual probes are a Thing! As I’ve said before, I like the idea of many probes, not just one per site. As costs come down, that becomes more feasible.
Recently, we’ve been trying ThousandEyes for an “outside-in” view of a network with performance issues. In one recent case, it found a problematic link within an AT&T colo where the customer’s web front end was located. One of six or eight links. I suspected it was in the core to distribution layer.
This article originally appeared on the NetsCraftsmen blog.


