When it comes to open-source tools for network engineers, a top choice is Wireshark, created in 1997 by Gerald Combs, who needed a tool to track network problems. Originally named Ethereal, the network analyzer is supported by a community that has added additional dissectors, features, and bug fixes.
Wireshark isn't just for wired networks; wireless network engineers can utilize the tool to help them troubleshoot and diagnose various WiFi issues. Before getting into the details of using Wireshark to capture WiFi traffic, let's go over the particular requirements.
In a Windows operating system, you need a network card capable of capturing wireless frames. The built-in network card is not capable of this because drivers may not allow a user to manually select a channel, or to place the wireless network in monitor mode.
On macOS, an engineer can natively collect wireless frames through the built-in wireless card. I highly recommend a free application called Airtool, which simplifies the capture of wireless frames in macOS by allowing easy channel selection and parameter modification. For example, you may want to capture frames on a 40MHz channel. It’s also possible to simply select an individual channel on either the 2.4 GHz or 5 GHz spectrum.
A counter displays the numbers of frames collected, and when you stop the capture, it's saved as a .pcap filed, which is saved to a location of your choice and automatically opened in Wireshark.
Reading wireless frames
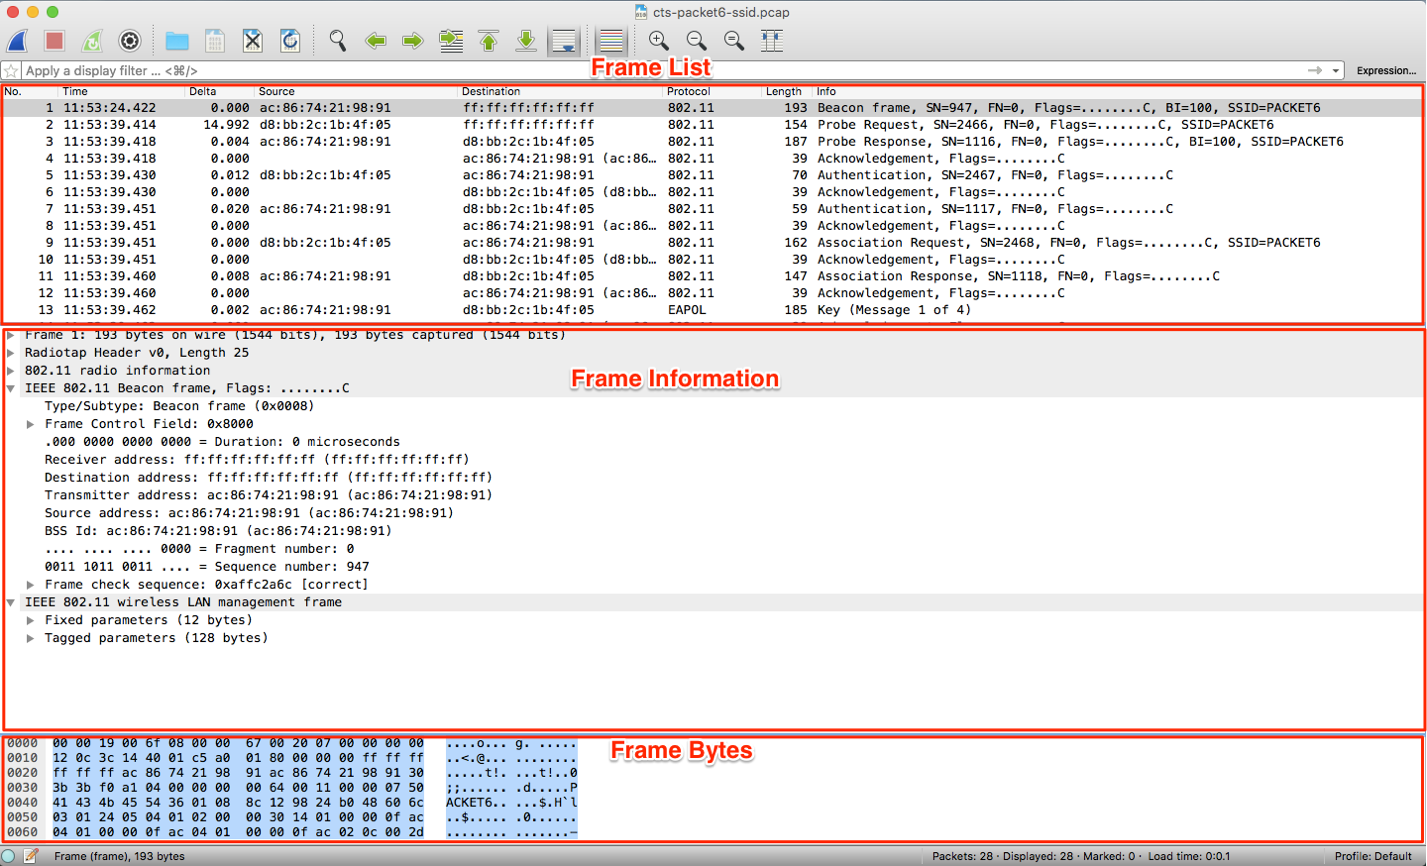
When opening Wireshark, you'll see a number of columns displaying various types of information. The application is broken out into three sections: frame capture list, frame information, and frame bytes.
With all this information in hand, a wireless network engineer can dive into detailed analysis by observing the source and destination MAC addresses, the type of frame by looking at the Frame Control Field, and more.
For example, you can view an SSID’s capabilities by examining a beacon frame from the access point. Within the beacon frame, the Frame Control Field will indicate that the beacon frame is a management frame with a subtype value of 1000.
The tagged parameters of the wireless management frame shows what the service set supports, such as the basic data rates, security, high-throughput capabilities, and vendor-specific capabilities. Digging into this information can help an engineer troubleshoot issues regarding client connectivity to an access point.
In addition to troubleshooting client connectivity, you can view client frame exchanges through Wireshark. An example is device authentication and authorization with an access point.
Encrypted frames
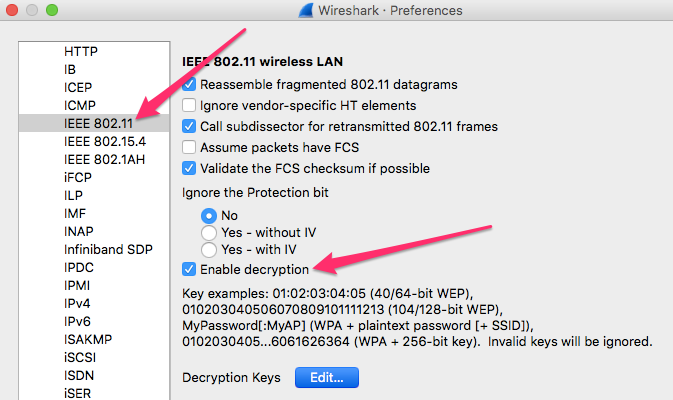
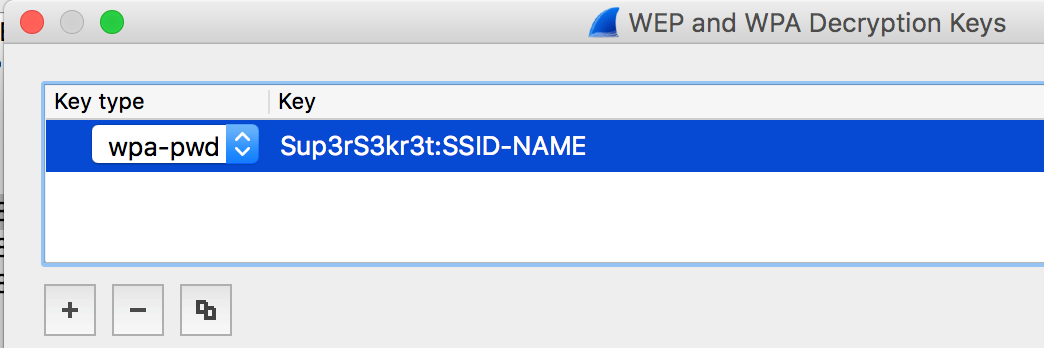
When capturing frames from a wireless network with WEP or WPA/WPA2 security, the details of the frame are encrypted preventing you from seeing details. If you know the password, you can decrypt the contents. Within Wireshark’s Preferences, under IEEE 802.11, enable decryption and insert the wireless network’s password to create the decryption key.
Visualizing wireless captures
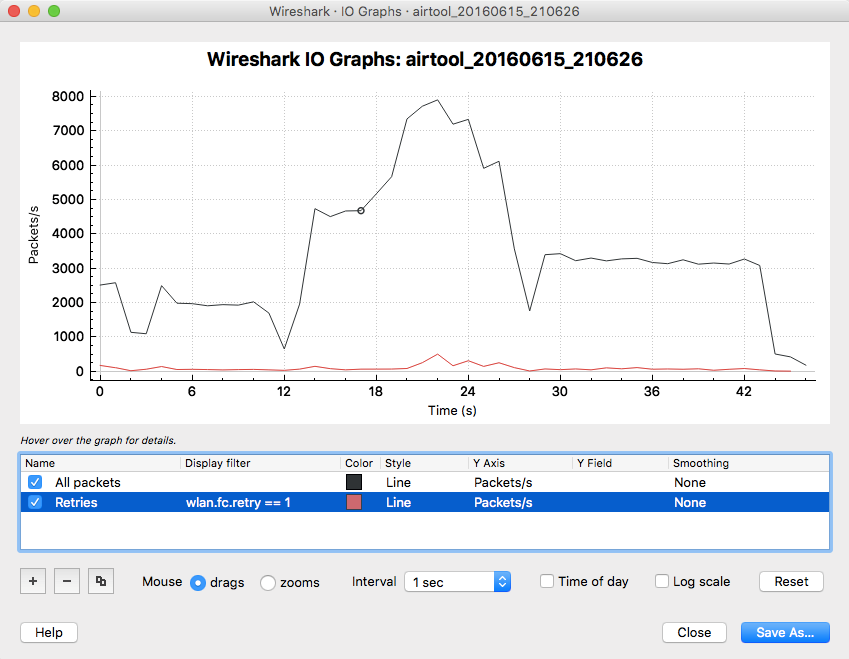
With the thousands of packet captures gathered by Wireshark, it is possible to look at the data in a different way using graphs. One example is viewing how many retry frames were detected out of the total amount captured.
To get a sense of how many retries occurred during your capture, navigate to Statistics > I/O Graph. In the graph window, click on the plus icon to add a new data point and rename it “retries.” Add a display filter of “wlan.fc.retry == 1” and change the color of this filter to red. Modify the Y Axis to display Packets/s, and enable “All packets.”
Now there is a graphical representation of the number of retries from your Wireshark capture.
Adding WiFi columns
By default, Wireshark doesn’t display any WiFi related columns. But it’s actually quite easy to add columns once you are aware of what kind of display filters you can work with.
Let’s say you want a column displaying the Duration of a frame. This would help you determine how much air time devices are using to communicate on the wireless medium.
To add a column, right click on any existing column and select Column Preferences. Any column with a checkbox indicates it is displayed in the Wireshark Frame List. Click the plus icon to add a new column. Give the column the name of “Duration,” a type of “Custom,” and a field name of "wlan.duration." Then click OK to close the column preferences window.
When viewing the list of frames, you can now see the Duration value which is taken from the Duration field of the 802.11 wireless header.
Other columns that may be useful include:
- Channel (wlan_radio.channel) - This can be used if you have an aggregated list of frames captured from different channels.
- Data rate (wlan_radio.data_rate) - To view what data rate the frame was sent at by the transmitter.
- MCS Index (wlan_radio.11n.mcs_index or wlan_radio.11ac.mcs) – To identify what MCS index was used by a transmitter of a frame. This is useful for 802.11n and 802.11ac.
Display filters
Sifting through hundreds or even thousands of wireless frames in Wireshark can feel like looking for a needle in a haystack. Fortunately, it is possible to narrow down a search through the use of display filters.
Display filters are used to identify specific types of frames or packets. There are many different fields and information elements to search on. Display filters are very specific so it can be frustrating at times when trying to find out which display filter to begin with. Here are some common filters:
- Filter for all frames with a specific MAC address
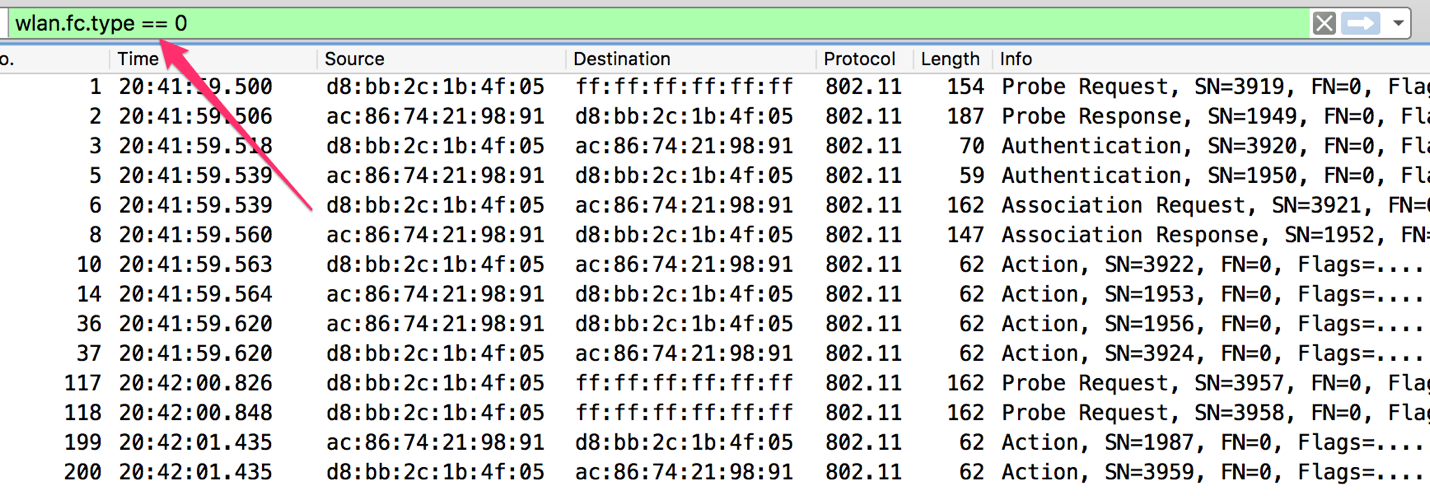
- Filter for all Management frames
- Filter for all Control frames
- Filter for all Data frames
For a list of more display filters, this blog includes a helpful PDF you can download for free.
Wireshark is an indispensable tool for network troubleshooting. Knowing the ins and outs of Wireshark will help turn a wireless network engineer into a network analysis expert.


