As benchmarks go, Iometer is, in many ways, like your old friend Stan from high school. You know the one: the guy who's still working at the Quick Stop, though he has made it to manager. Even though the rest of the gang has matured and moved on, you still invite Stan to all the group get-togethers because, while time has passed him by, he's still a good guy and makes everyone comfortable.
I've been writing for years about how simple synthetic load generators like Iometer have fallen behind modern storage systems and that, in many cases, a simple load generator will give misleadingly high or low results.
To better simulate what people will see in the real world, the benchmark tool bag at DeepStorage Labs has expanded well beyond just Iometer. We use more sophisticated, application-specific tools like Microsoft's JetStress, which uses the Exchange JET database engine and LoginVSI for VDI. We also use Dell's Benchmark Factory, which can create workloads -- including those that mirror the Transaction Processing Performance Council benchmarks -- against a real MySQL or SQL server.
However, there are still times when slamming an SSD with 4K random IOPS or a secondary storage system with 1MB sequential writes can tell us useful things about the system under test. FIO or VDbench might be more powerful than Iometer, and VDbench, like real applications, can create hot spots, but 20 years of experience with Iometer leads me back to my old, if not that clever, friend.
Frankly, Iometer hasn't gotten all that much love since Intel turned it into an open-source project on SourceForge. The latest stable version, after all, is from 2006, though most folks use the 2008 version that supports multiple data patterns.
One of Iometer's limitations has always been that it reports data only at the end of a test phase, making it unsuitable for any sort of testing where performance over time is an important consideration. One classic example would be investigating the latency of an SSD. Consider two SSDs that can each deliver an average latency of 800 µs for a given workload. One delivers between 700 and 900 µs all the time. The other delivers 600 µs of latency 90% of the time but will slow down to several milliseconds when forced to do housekeeping and garbage collection. Which would you want, and how would you collect that data with Iometer?
What many people, and some websites that shall remain nameless, do is tell Iometer to run, say, a 4K write workload for one minute per phase and then repeat that process 100 or 200 times. They then have average and maximum latencies for each phase and can graph the data across time.
There's only one problem with that approach: Iometer stops presenting load to the SSD for some period of time -- it could be as little as a hundred milliseconds -- as it ends a phase, writes the results, and starts a new phase. That small period of idle time gives the flash controller in the SSD time to perform garbage collection and makes the results less realistic.
As a longtime user of Iometer, I started thinking about this problem and decided what I wanted was for Iometer to output to a file the performance data as it updated its onscreen bars. Since I could already tell Iometer to update the screen every minute or every second, that would get me the right time series data without introducing the idle periods and would be a lot easier to run. I saw on the Iometer LinkedIn group that other people wanted this, too, and we started figuring out how to get it.
I had DeepStorage's head LabRat Ramón write up a spec for this addition to Iometer, and I was about to shop it at eLance.com when I decided to post it to the Iometer developer's mailing list. Since I hadn't seen any real activity on that list in a long time, I wasn't expecting anything, but I thought it would be rude to have a custom version developed for me without at least asking.
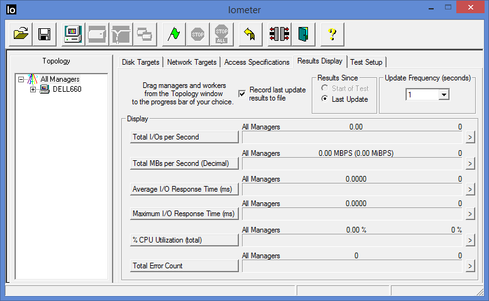
Much to my pleasant surprise, I got an email from Wayne Allen, one of the Iometer developers, who said he was working on a solution to my problem. Even better, a few weeks later, he sent me a copy of Iometer 1.1 Release Candidate 2, which not only output all the data Iometer has always reported but also created a second results .CSV file, which has a record that's created at the same frequency as the results screen is updated.
Figure 1:
Iometer's new option to record data on screen update.
Even better, in addition to the average and maximum latencies seen during the test period, it breaks the latency down into 21 latency bands from 0-50 µs to more than 10 s, showing the number of I/Os in each band. We plan to use this in our testing to be able to graph not just the average latency but also the standard deviation, 90th, and 95th percentile latencies for the gear we test.
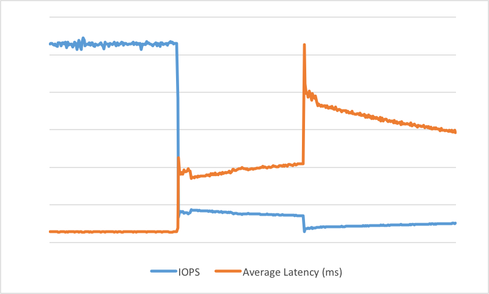
The addition of time-domain data also lets us generate great graphs like the one below, which shows the IOPS and latency impact of a bad snapshot.
This new feature has put Iometer back at the top of my benchmark stack. Like my old friend Stan, every once in a while, it surprises you in a good way.


