Capturing packets for network analysis seems pretty straightforward: Install your favorite packet capture tool, hit start, stop and save your trace. What could possibly be a problem?
Unfortunately not all protocol analyzers are created equally. For the purposes of this article, I will refer to two broad categories of network analyzers: dedicated hardware-based and general software-based tools
Hardware-based protocol analyzers are straightforward since they are specifically built to capture packets. The general software-based tools are exactly that software you can download and install on various systems. Both types of analyzers have their place.
When I need to perform network latency analysis or troubleshoot a performance-related issue that requires millisecond or lower accuracy, I reach for a hardware-based analyzer. Many times, I use a hardware-based analyzer to capture packets and then use Wireshark software to analyze the data. Wireshark is user-friendly and I can run it on my laptop instead of lugging around a hardware analyzer. If a trace file is too large, I use Wireshark’s editcap utility to break the large trace file into smaller ones.
When I need to capture data and perform protocol analysis or application profiles, I’m comfortable using software analyzers on my laptop. This is due to the fact that all I need is the packets and addresses to determine application flow or dependency; I don't need the timings.
Software analyzer limitations
Since the software-based analyzer wasn’t designed for a specific type of operating system or computer, be aware that it will have some limitations. For example, if you install Wireshark on a Windows-based computer, it has to contend with other Windows services while capturing packets.
In addition, configuration issues may arise due to interference from endpoint security, firewalls and other CPU-intensive applications. Some people I have spoken to think that running the software analyzer on Linux or Apple is the answer. Unfortunately this may not help since you need to understand quite a bit about your computer hardware, configuration and operating system behavior to get an accurate picture of hardware performance.
Then there are some of the wildcard issues like using USB Ethernet adapters without knowing what version they are or remotely capturing from an interface (i.e. rpcapd). Both scenarios may result in lost packets or inaccurate time stamps. The best-case scenario is that you drop packets because you might notice that and then figure out why it's happening or try a different tool. Inaccurate time stamps are the worst because you will probably be unaware when this happens. I’ve seen many analysts assume that if they capture all the packets, then the delta times must be accurate.
Generally speaking, in a Windows environment, Wireshark uses WinPcap software and Microsoft’s NDIS to capture packets. According to the WinPcap website, “WinPcap consists of a driver that extends the operating system to provide low-level network access, and a library that is used to easily access the low-level network layers.”
Lab setup
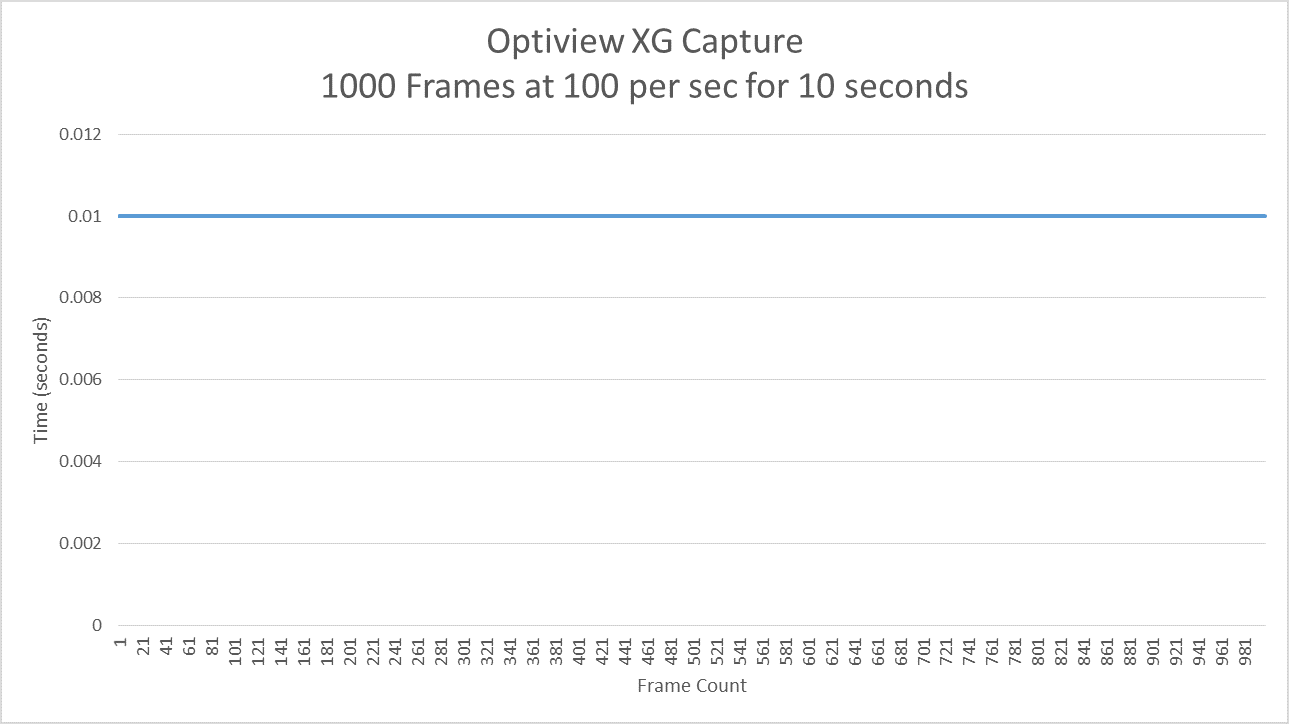
To demonstrate the different results you can get with hardware vs. software analyzers, I set up a lab and ran a couple tests. I used NetScout OptiView XG because I just happened to have access to two of them while writing this article. My first test was a control test in which I generated packets using Optiview XG, connected using a cross-over cable to another OptiView XG for packet capture. I did not send a ridiculous amount of data in order to show you that it doesn’t take much to see a difference. I only sent 100 packets per second for 10 seconds with a packet size of 1,024 bytes.
In the second test, I had the Optiview XG generate the same stream, but my laptop capture the packets using Wireshark. I used an Alienware Killer e2200 gaming laptop with a Gigabit Ethernet controller, i7 processor, 16GB of RAM, and minimal software/services installed.
The methodology I used was to take the captured packets, filter out just the traffic stream, create a CSV file and graph the delta time between the packets.
The first chart shows the XG back-to-back test results. The delta time shows a very consistent delta time of 10 milliseconds with no dips or spikes.
The second chart below shows the delta times from the test with the laptop all over the place. It is important to remember that the only application running was Wireshark and the computer wasn’t doing anything other capturing packets.


