Want to see an IT pro cringe? Just mention the classic user network complaint, “It's slow.” When I hear this, I try to understand what the user means by "it" and "slow." I know it sounds obvious, but trust me, I’ve had situations where a group of technicians in a war room argued these two points for hours.
The other challenge we face when we need to document the complaint is where to start: near the client, the server, or somewhere in the middle. All three have their pros and cons, but I want to focus on the merits of starting near the client.
Let's look at the user problem in more detail: Mary is having consistent performance issues while retrieving a client’s record using a homegrown application called ACME Query. Mary is the only person reporting an issue at this time. The application has a web interface and on the backend, the web server communicates with a SQL database server. Both servers are on the same VLAN in the same physical data center.
When investigating the issue from her computer using Wireshark, Microsoft Message Analyzer or whatever network protocol analyzer you prefer, I suggest performing the following captures: application launch, login, query. Even if you do not have a baseline on her computer, you can get a lot of information from these captures.
Now that you’ve captured the data, make sure you have your protocol analyzer configured to display the delta time. I would suggest you look at the name resolution protocols then the HTTP traffic and make a mental note of the typical response time. If you notice there is an extended response time (compared to others), note the source address. If you are fortunate, you might see that the source address is her computer and now you can work on a local issue.
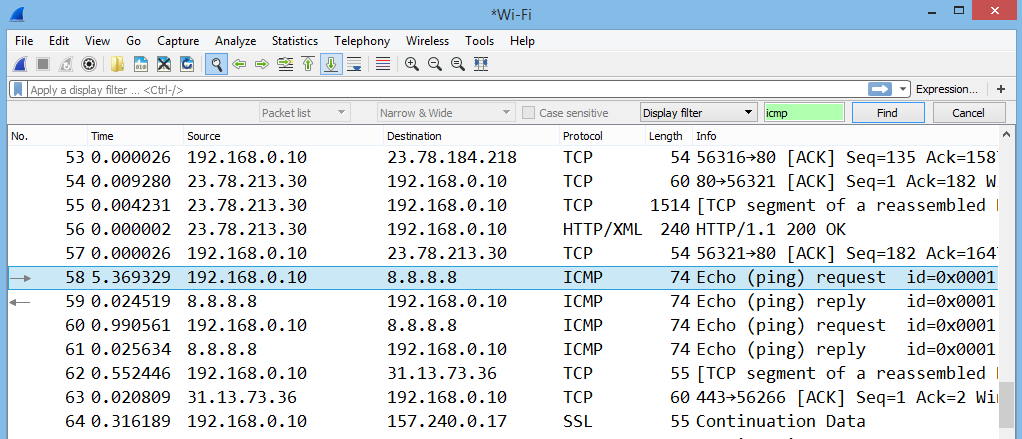
If the large delta times are from the web server, then you can take another capture from both ends simultaneously and confirm that the network transit times are acceptable. Also look for dropped packets. If so, move the second capture point around to determine where things go bad. The tricky part is determining whether there are delays when the query is performed or when the SQL server gets involved. If the packets are not readable, simply ask the IT team to ping a server before performing the query. Then search for the ICMP or ping packet as a sort of bookmark.
This methodology will work across a variety of networks and applications.
By working from the client side, you have a consistent starting point, control over what tasks are being performed, and the ability to make any changes in order to see if they negatively or positively affect the problem.
Note that in many troubleshooting scenarios, it's usually helpful to have a baseline of some kind on file to reference. Performing baselines can sound overwhelming and there are many excuses to avoid them. I try to get my clients to perform a simple capture from the user's computer, logging in and performing various tasks. After capturing the packets, just make sure the trace file is saved with a descriptive name and use Wireshark’s File comment feature for more notes. Then just file it away in case you need it in the future.
Overall, my goal here was to provide a methodology for tracking down the source of latency and to convince you that the user is a good place to start. I have used this same basic methodology on large networks with very complicated applications. The key is to become focused and organized if the network or application is large by breaking things up into manageable pieces.


